


The Shiba Inu (SHIB) price has fallen since a rejection from a long-term pattern on December 17, 2023.
SHIB trades inside a short-term corrective pattern and falls below a horizontal support area.
SHIB Attempts to Reclaim Support
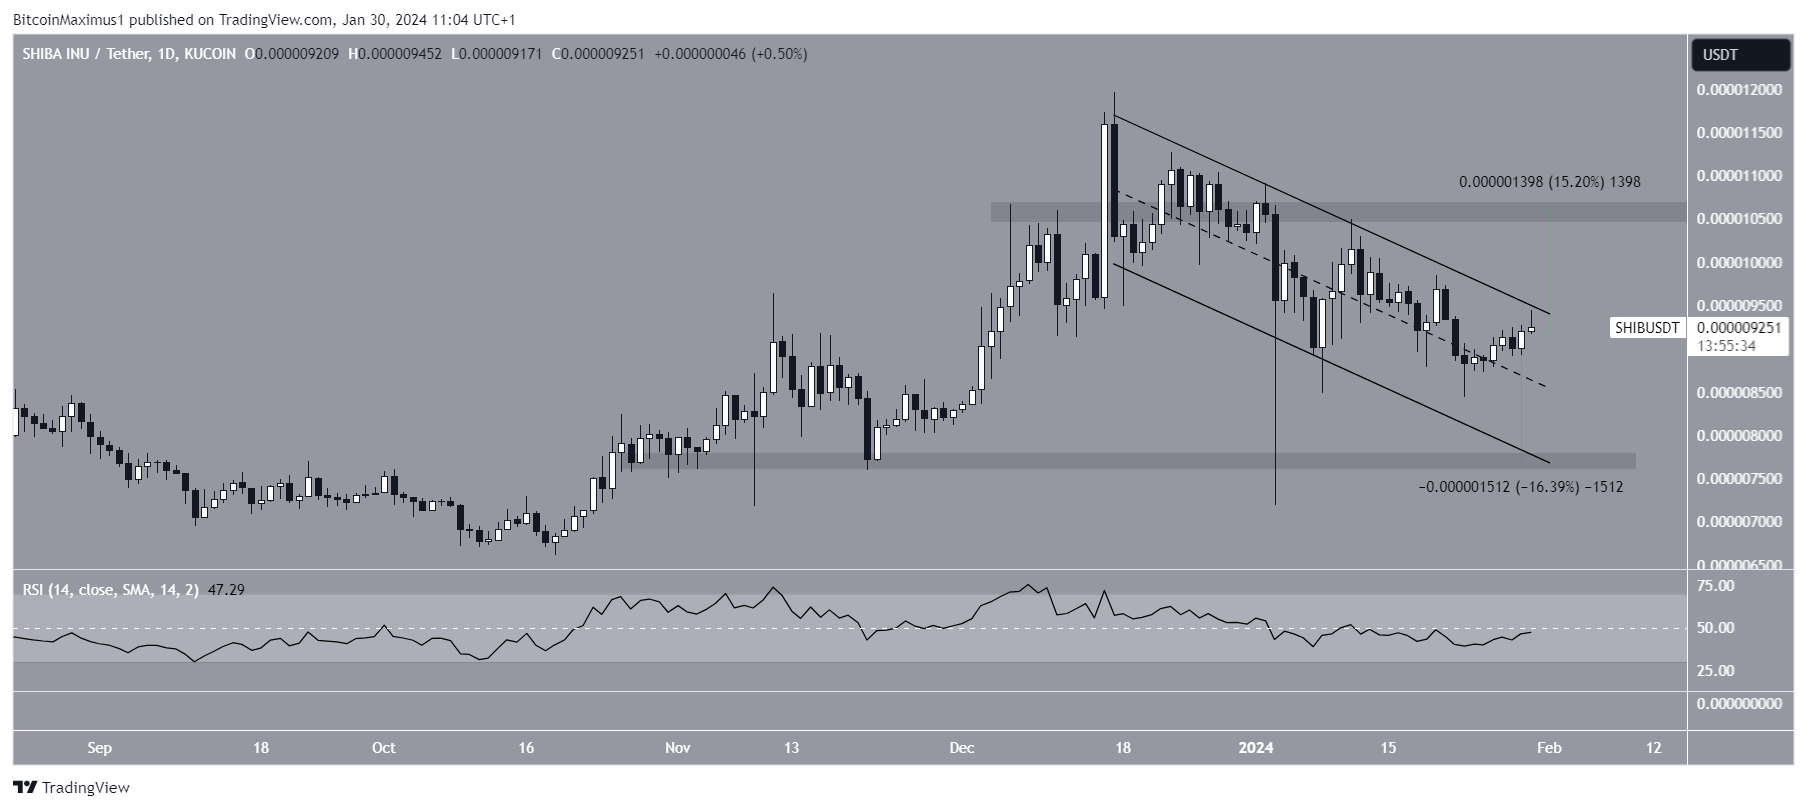
The technical analysis of the daily time frame shows that the SHIB price has traded inside an ascending parallel channel since June 2023. The upward movement led to a high of $0.0000120 on December 17. The SHIB price was rejected afterward (red icon), validating the channel’s resistance trend line.
SHIB has fallen since and trades below the channel’s mid-line. Also, it fell below an important horizontal support area and is now validating it as resistance.

The daily Relative Strength Index (RSI) gives a mixed reading, leaning on bearish. When evaluating market conditions, traders use the RSI as a momentum indicator to determine whether a market is overbought or oversold and whether to accumulate or sell an asset.
If the RSI reading is above 50 and the trend is upward, bulls still have an advantage, but if the reading is below 50, the opposite is true. While the RSI is increasing, it still trades below 50 (red circle).
SHIB Price Prediction: Breakout or Rejection?
The shorter-term six-hour chart shows that SHIB has fallen inside a descending parallel channel since the rejection on December 17, as mentioned above. Such channels often contain corrective movements, meaning that they are expected to lead to breakouts most of the time.
However, SHIB was rejected by the channel’s resistance trend line today (red icon), creating a long upper wick. Also, the six-hour RSI is below 50, a sign of a bearish trend. If the rejection continues, SHIB can fall 16% to the channel’s support trend line and the horizontal support area at $0.0000076.
Despite this bearish SHIB price prediction, a breakout from the channel can trigger a 15% increase to the next resistance at $0.0000105.
For BeInCrypto’s latest crypto market analysis, click here.
Disclaimer
In line with the Trust Project guidelines, this price analysis article is for informational purposes only and should not be considered financial or investment advice. BeInCrypto is committed to accurate, unbiased reporting, but market conditions are subject to change without notice. Always conduct your own research and consult with a professional before making any financial decisions. Please note that our Terms and Conditions, Privacy Policy, and Disclaimers have been updated.