


The Bitcoin (BTC) price began in 2024 with a massive increase, reaching above $45,000 for the first time in more than 600 days.
The BTC price increase also caused a close above a critical horizontal area. With the ETF approval drawing near, how long will this increase continue?
Bitcoin Closes Above Resistance
The BTC price has increased since October 2023. The rally led to a high of $44,729 at the start of December, also causing a breakout above a long-term horizontal and Fib resistance level. Bitcoin began to consolidate afterward.
Nevertheless, the Bitcoin price increased significantly this week, immediately breaking out above the 2023 high and reaching $45,920, the highest price since April 2022.
The deadline for the SEC to decide on the Bitcoin ETF approval is on January 10, causing rampant speculation as to how it will affect the BTC price.
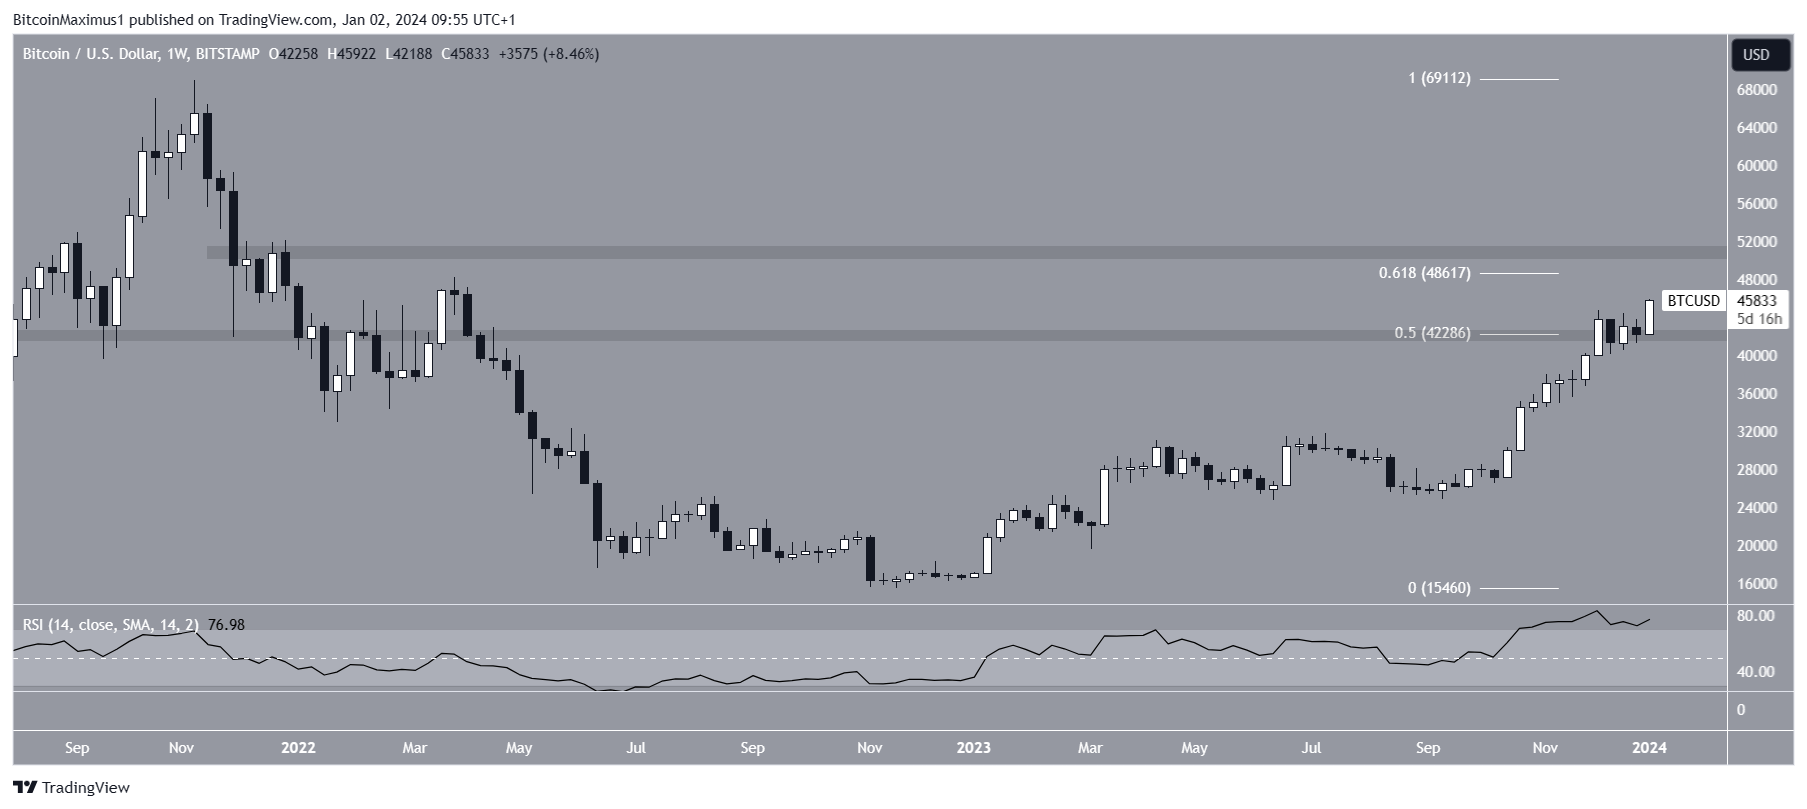
Market traders use the Relative Strength Index (RSI) as a momentum indicator to identify overbought or oversold conditions and to decide whether to accumulate or sell an asset.
Readings above 50 and an upward trend indicate that bulls still have an advantage, whereas readings below 50 suggest the opposite.
The RSI is in overbought territory but still increasing. Also, there is no confirmed bearish divergence to warn of an impending decrease.
What Do the Analysts Say?
Cryptocurrency traders and analysts on X have a bullish outlook on the future BTC price trend.
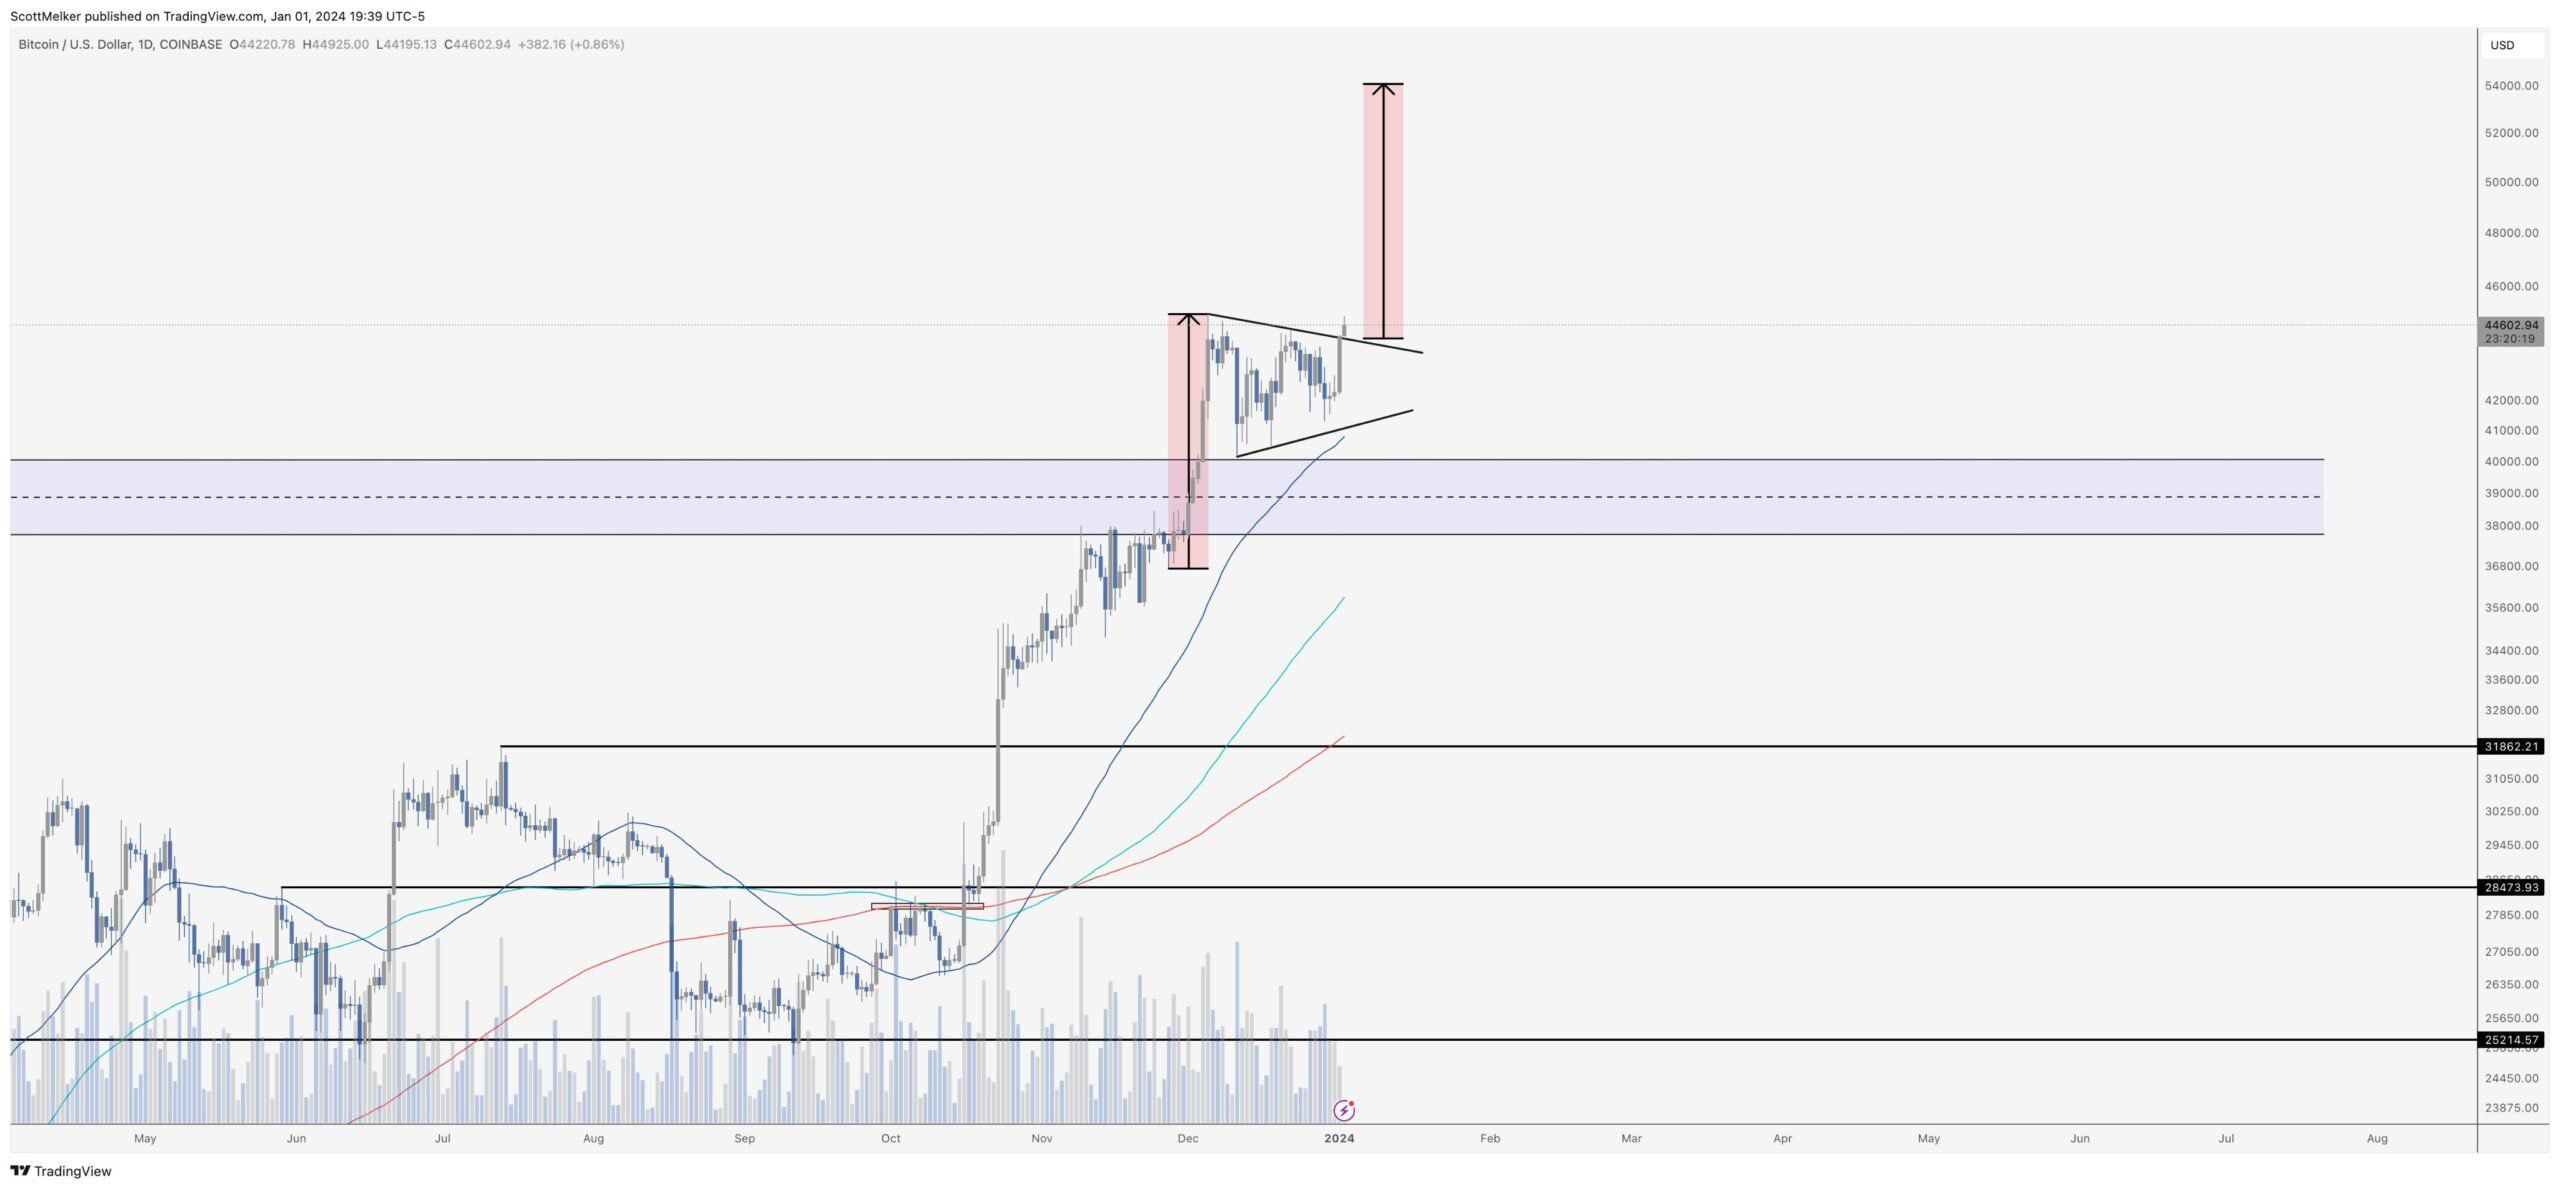
Scott Melker is bullish because of a breakout from a symmetrical triangle. He tweeted:
Breaking out of the bull pennant after nearly a month of consolidation. The target based on the measured move from the length of the flag is roughly $54,000. Targets rarely hit, anything can happen. But that’s what the chart says.
CryptoMichNL also expects a continuation toward $50,000 since the area coincides with the high range. He also suggests the impending ETF approval can catalyze this upward movement. Finally, because of the breakout above $45,000, Shardi B believes that the price will gradually increase to its all-time high.
BTC Price Prediction: $50,000 Incoming?
Technical analysts utilize the Elliott Wave theory to ascertain the trend’s direction by studying recurring long-term price patterns and investor psychology.
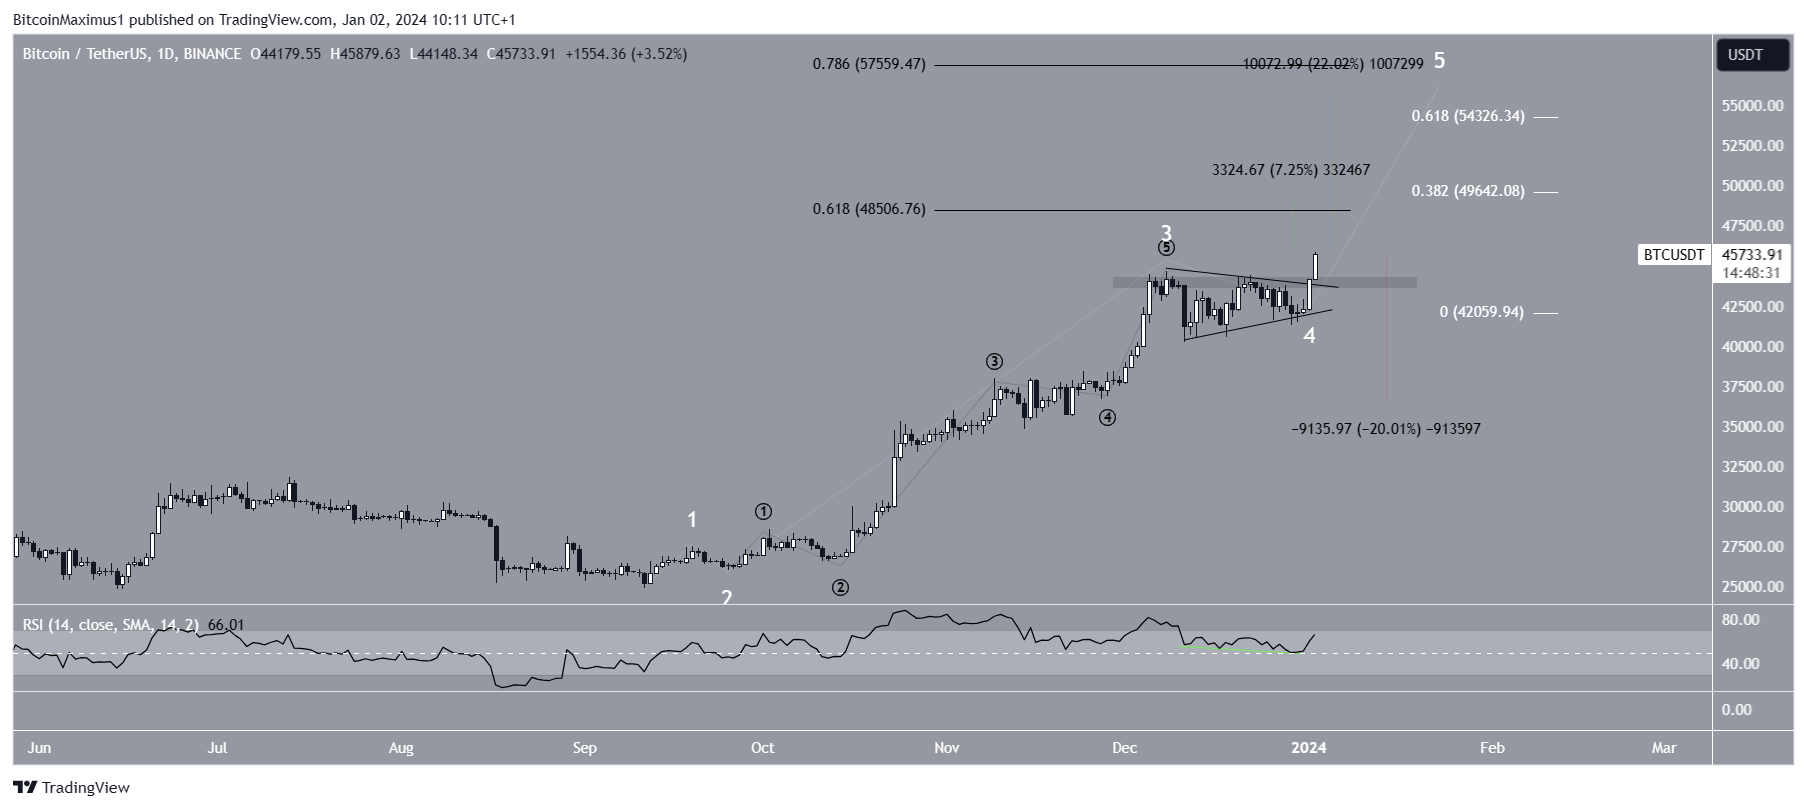
The most likely wave count indicates that the BTC price is in the fifth and final wave of an upward movement that started in September. The count is characterized by the symmetrical triangle in wave four, the most common pattern in the corrective wave.
The RSI supports this increase since the indicator generated a hidden bullish divergence (green) during wave four.
If the count is correct, the BTC price will reach the first confluence of resistances between $48,500 and $49,600, 7% above the current price. The area is created by the 0.618 Fib retracement resistance level (black) and will give wave five 0.382 times the length of waves one and three combined (white).
If the rally extends further, the next resistance will be 22% above the current BTC price, between $54,300 and $57,500.
Despite the bullish BTC price prediction, closing below $44,500 will mean the local top is in. Then, the BTC price can fall by 20% to the closest support at $36,500.